Dashboard
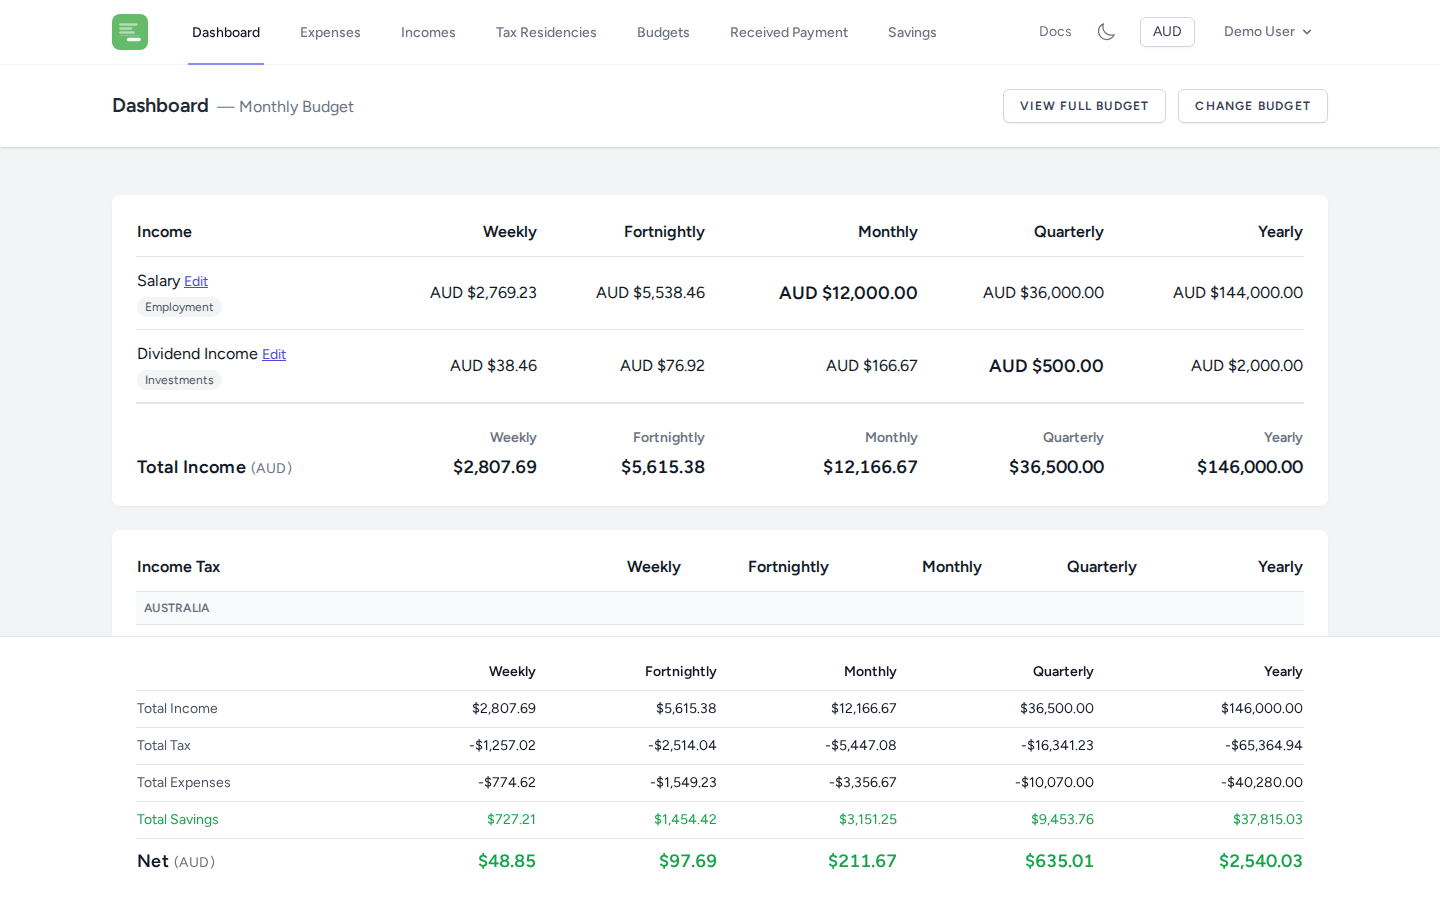
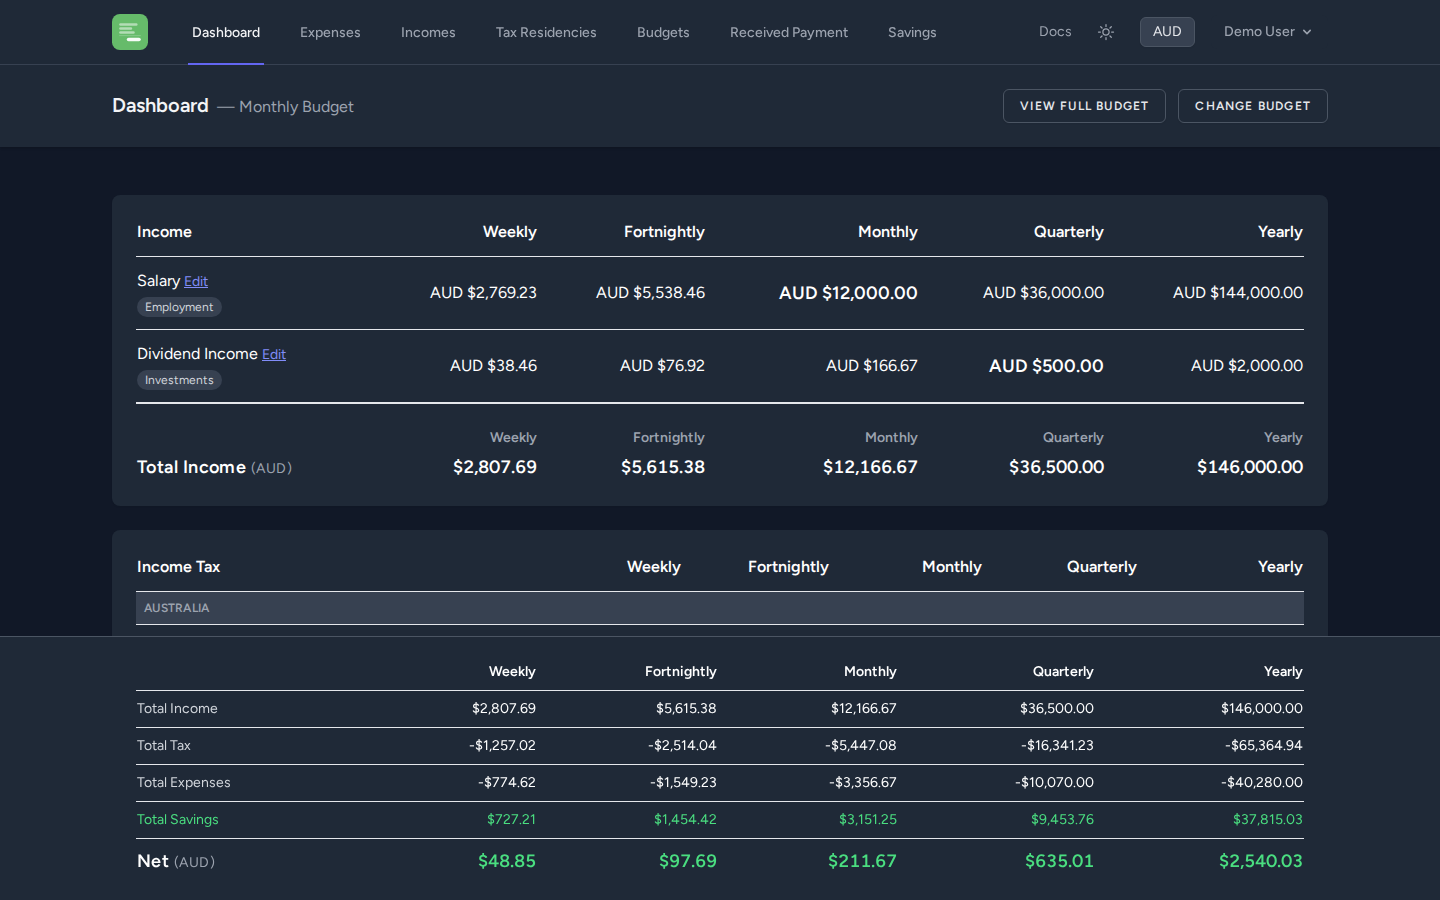
The dashboard is your financial overview. It shows a complete breakdown of your selected budget's income, tax, expenses, and savings across multiple time frequencies.
Budget selector
At the top of the dashboard you can switch between budgets. Your default budget is shown first; you can change your default from the Budgets page.
Income card
The income card lists all income items assigned to labels in your selected budget. Each income is shown with its amount converted to your display currency across five frequencies: Weekly, Fortnightly, Monthly, Quarterly, and Yearly.
If an income item is in a different currency, the original amount is shown below the converted figure.
Tax card
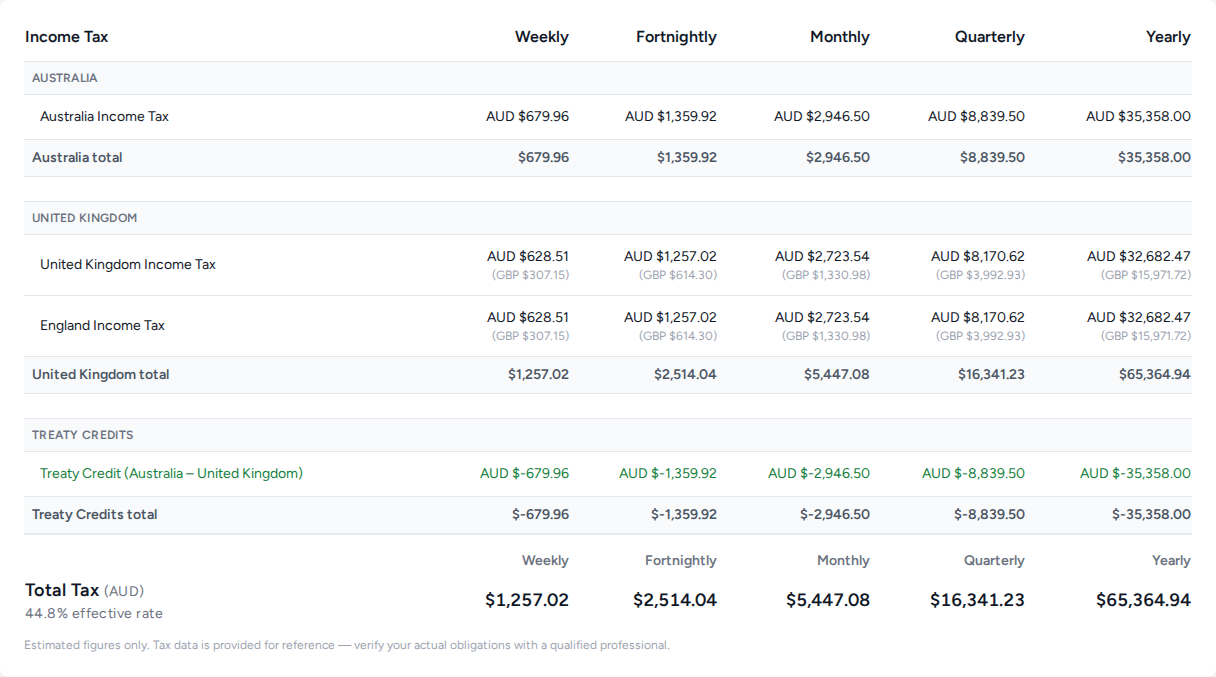
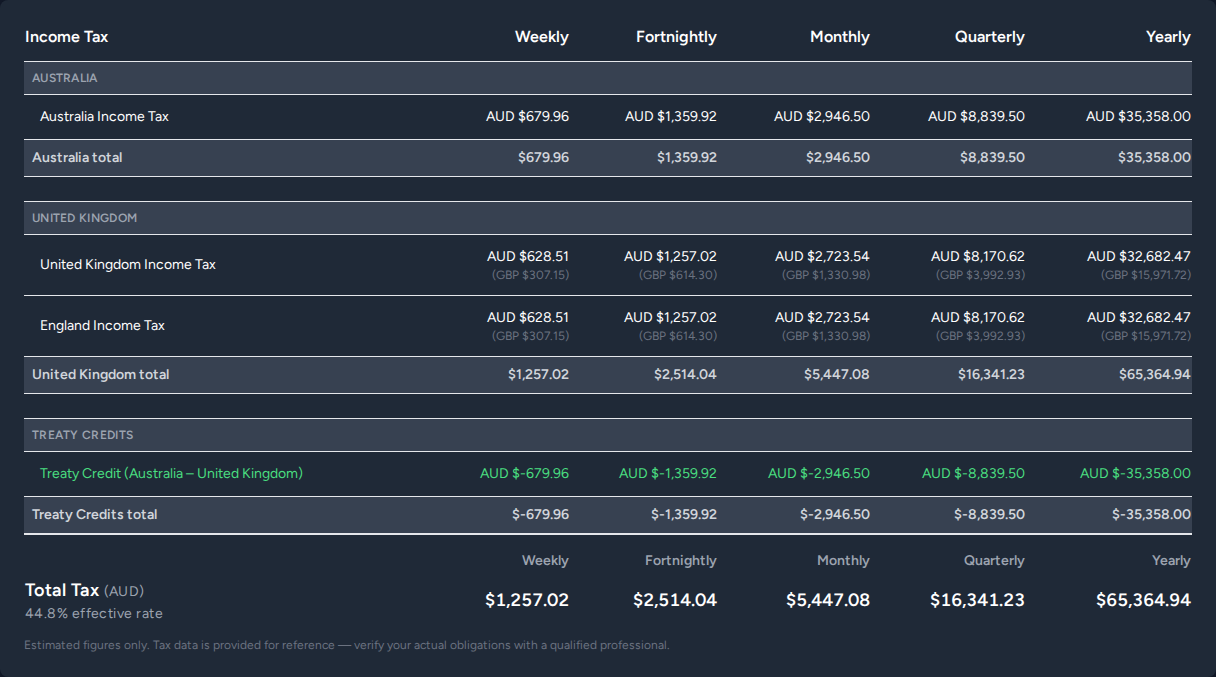
The tax card calculates estimated tax based on your Tax Residencies and the income in this budget.
- If you have multiple residencies, each is shown separately
- Effective tax rate is displayed
- If a tax treaty between your residencies is active, treaty credits are applied and shown
- If the budget has a tax override (a fixed percentage or fixed amount), that is used instead of the residency-based calculation
Tax figures are estimates based on the bracket data provided. Always verify your actual tax liability with a qualified professional.
Expense card
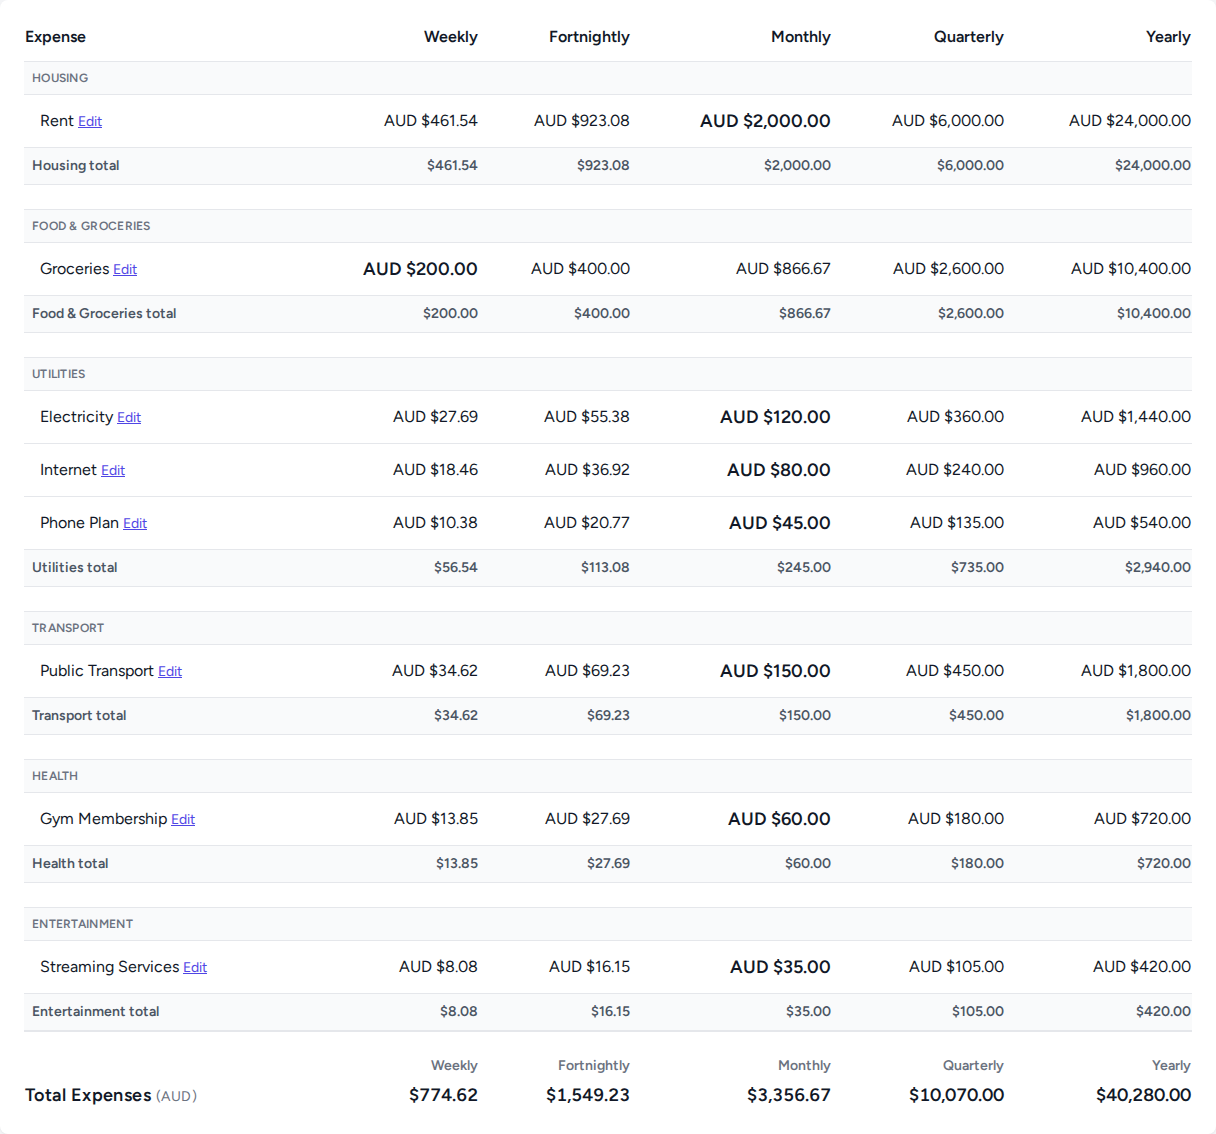
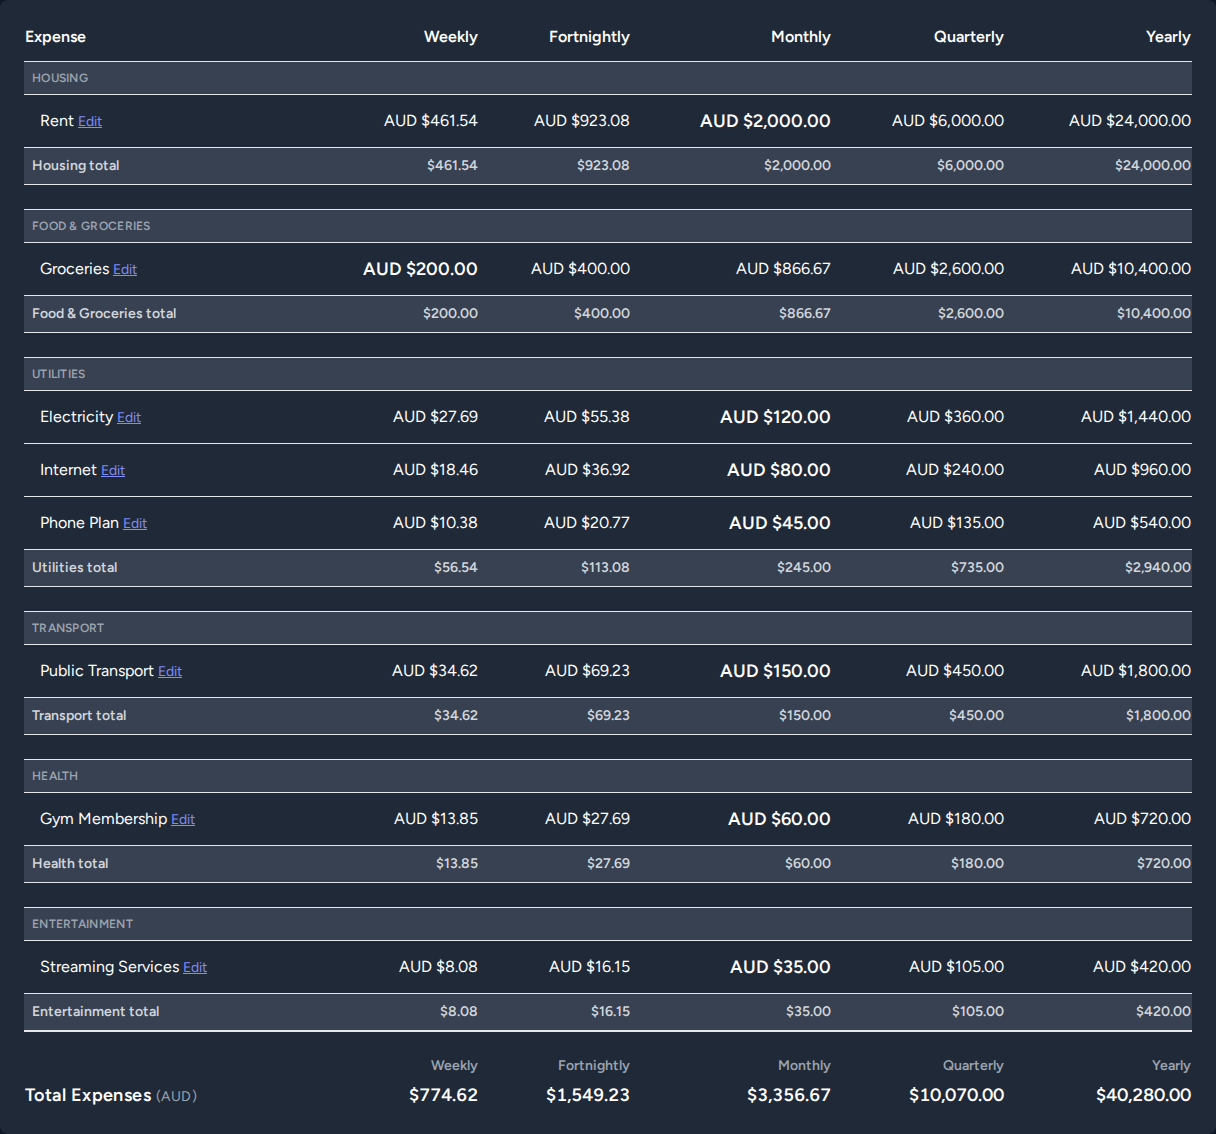
The expense card lists all expense items assigned to labels in your selected budget. Like incomes, each item shows converted amounts across all five frequencies.
You can sort by column (name or any frequency) and toggle Group by label to reorganize the table so items are grouped under their labels with subtotals per group.
Savings card
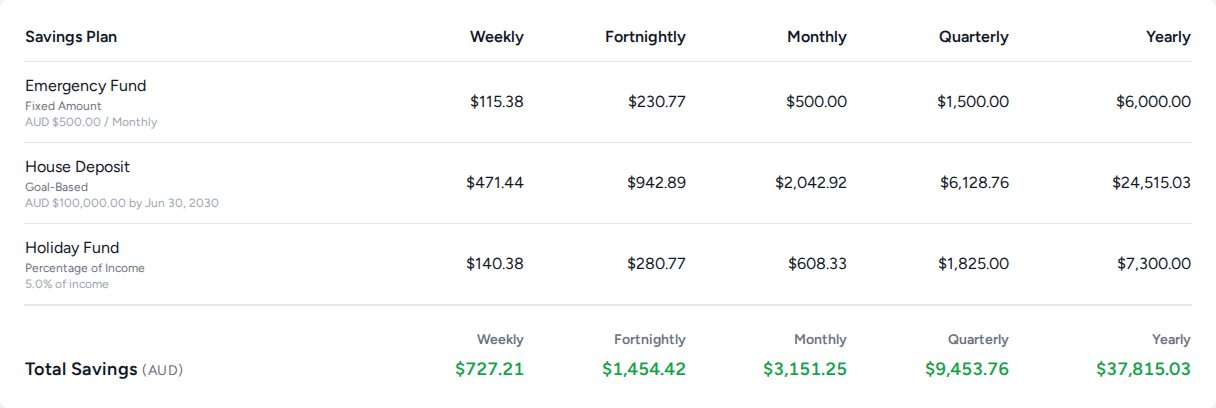
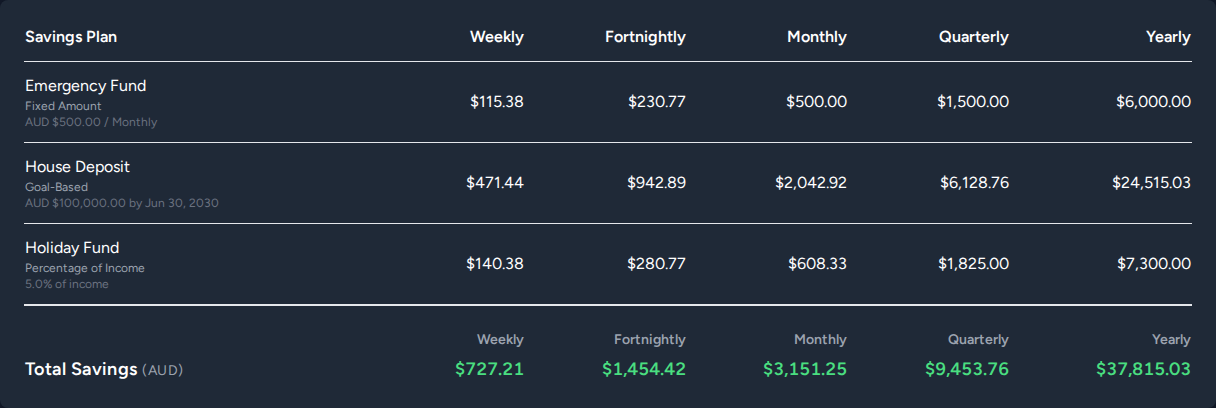
The savings card shows all savings plans linked to this budget. Each plan is shown with its calculated contribution for the period based on its strategy.
Plans using a residual strategy are shown separately at the bottom, since their amount depends on what remains after all other calculations.
Net summary
At the bottom of the dashboard, a summary table shows:
| Row | Description |
|---|---|
| Income | Total income across the budget |
| Tax | Estimated tax |
| Expenses | Total expenses |
| Savings | Total savings contributions |
| Net | Income − Tax − Expenses − Savings |
The net row is highlighted. A positive net means unallocated surplus; a negative net means the budget does not balance.
Each row has a quick-link to navigate to the relevant section.